Product dashboard KPIs
Summary KPIs shown on a product record

Written by Ian Oldrey
Updated at January 3rd, 2023
Table of Contents
When looking at a product record these Dashboard KPIs give useful summary information about the product.
Available to User types
| Ops | Basic | Pro | Super | Prime |
 |
 |
 |
 |
 |
Product KPIs
Not all KPIs are available to all user roles.
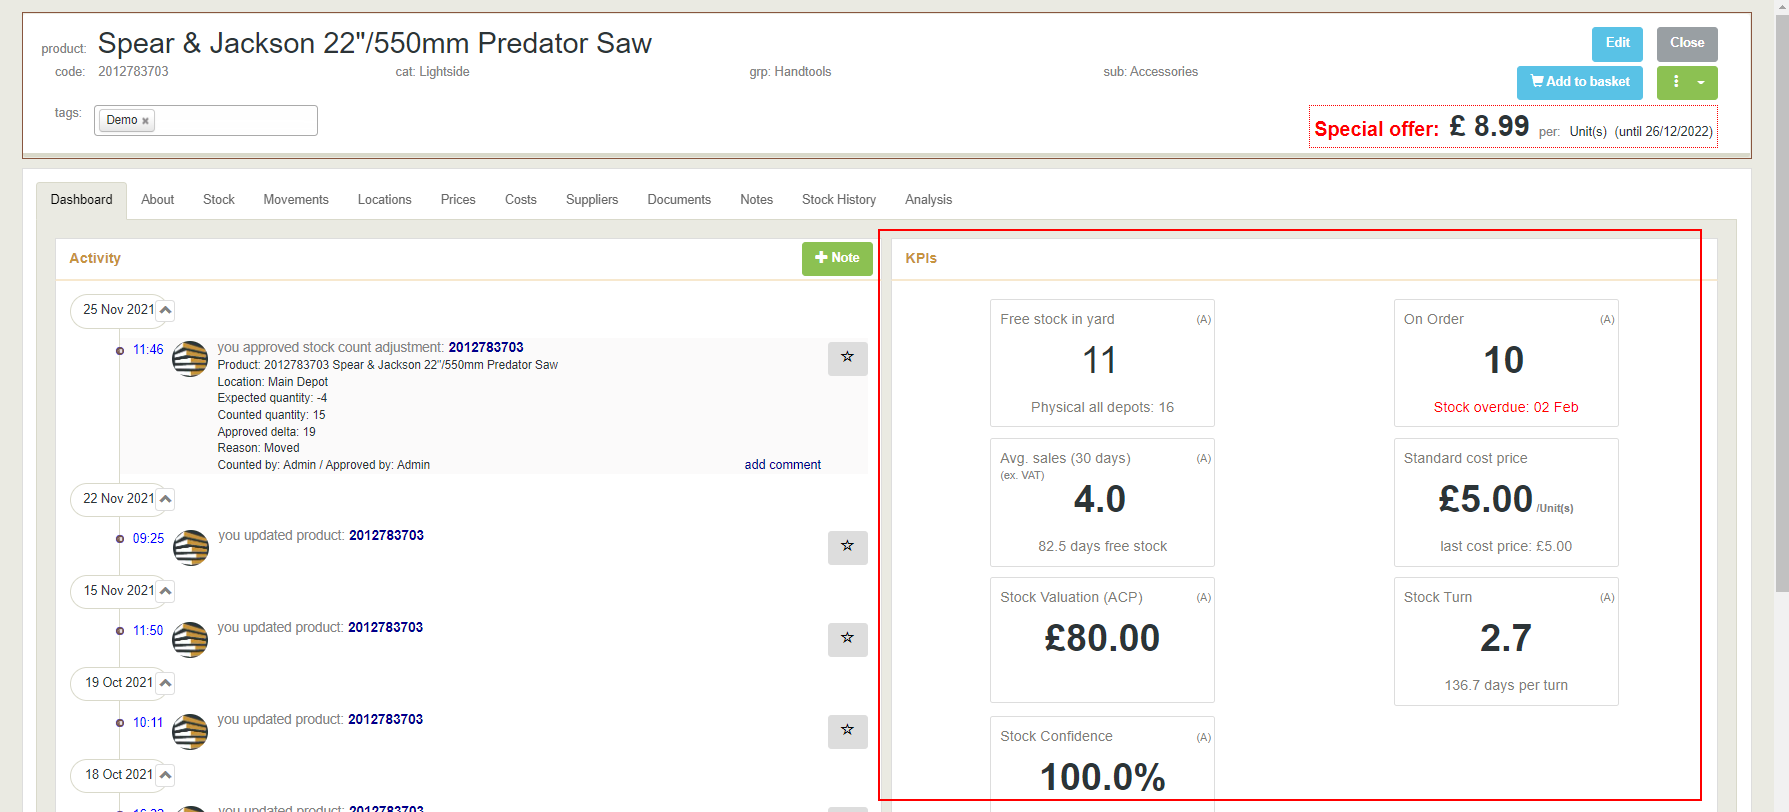
Free stock in yard
Main value: Shows the free (available) stock at the depot that you are logged into
Secondary value: Shows the total physical stock at all depots
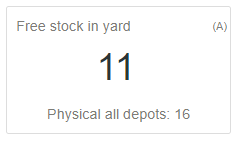
On Order
Main value: Shows the on order (purchased and mill orders) to be received at the depot that you are logged into
Secondary value: Date of next receipt of stock (highlights red if overdue)
Drill down: list of forward stock movements
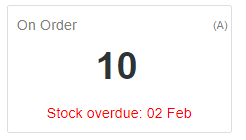
Average Sales (30 days)
Main value: Shows the quantity sold and/milled (usage) over the last 30 days
Secondary value: Shows the number of days stock available based on last 30 days usage
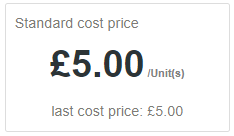
Standard Cost Price
Main value: Shows the current Standard Cost Price (SCP) for this product
Secondary value: Shows the Last Cost Price (LCP) for this product
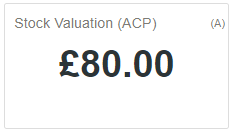
Stock Valuation (ACP)
Main value: Shows the value of stock based on the Average Cost Price (ACP) for the depot logged into
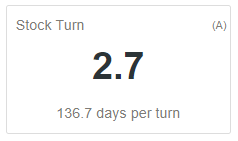
Stock Turn
Main value: Shows the rate of stock turn for this product. The higher this number the more effectively the stock is working for the business.
Stock turn example
If you have a product with an average of 10 in stock and sells 10 a month it would have a stock turn of 12.
If you still had an average of 10 in stock but sold 20 a month the stock turn would be 24
If you dropped the average stock to 5 and still sold 10 a month the stock turn would also be 24
If you increased your average stock to 20 and started selling 20 a month you would have a stock turn of 12
30 day stock turn calculation
Stock turn is based on the sales over last 30 days divided by the average stock held over the last 30 days. This is multiplied up to give a predicted stock turn for the year.
This KPI works on a 30 day calculation to quickly give stock turn figures to new users. This is less accurate for seasonal products
Secondary value: Shows the number of days stock you are likely to have based on the current stock holding and how often that stock is turning over
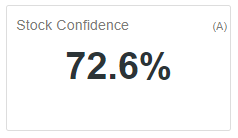
Stock Confidence
Main value: Shows the stock confidence percentage for this product
Stock Confidence
Stock Confidence is a rating on the confidence of the stock you have.
When a product has stock first entered, or a stock count is done it gets a confidence rating of 100%.
The confidence rating degrades over time at a rate calculated by an algorithm. The algorithm is influenced by factors such as how much you have in stock, how often the product sells or is used for milling, and how close the last stock count was to what the system expected to find.
Highly active products will lose their confidence rating more quickly, prompting for them to be checked (counted) more frequently
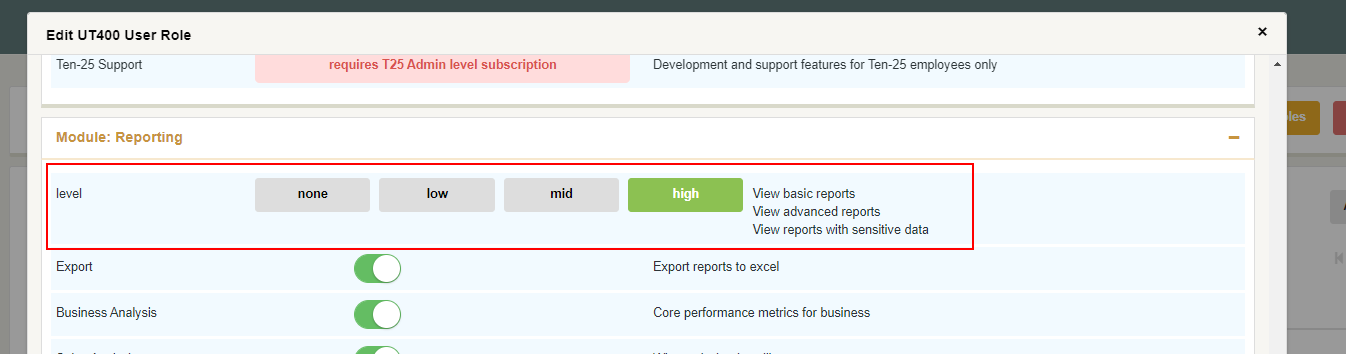
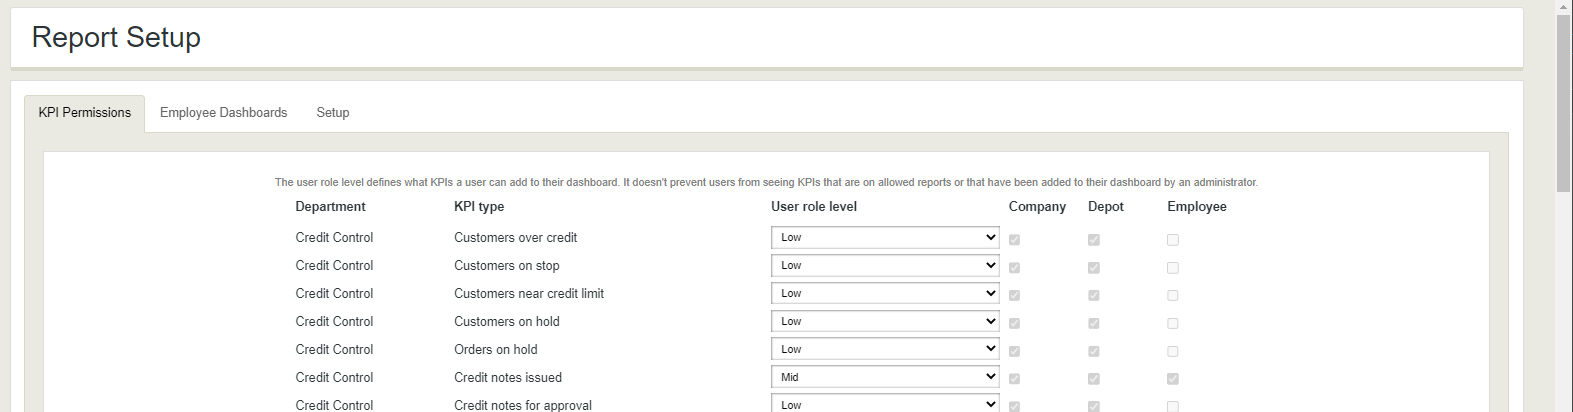
- Settings
- Reporting
- KPI Permissions
- Set each KPI to the minimum user role level that can view it (none/low/mid/high)
Build Number: 001
Release Month & Year: Mar/2020